Reference documentation
Summary of available sections and features
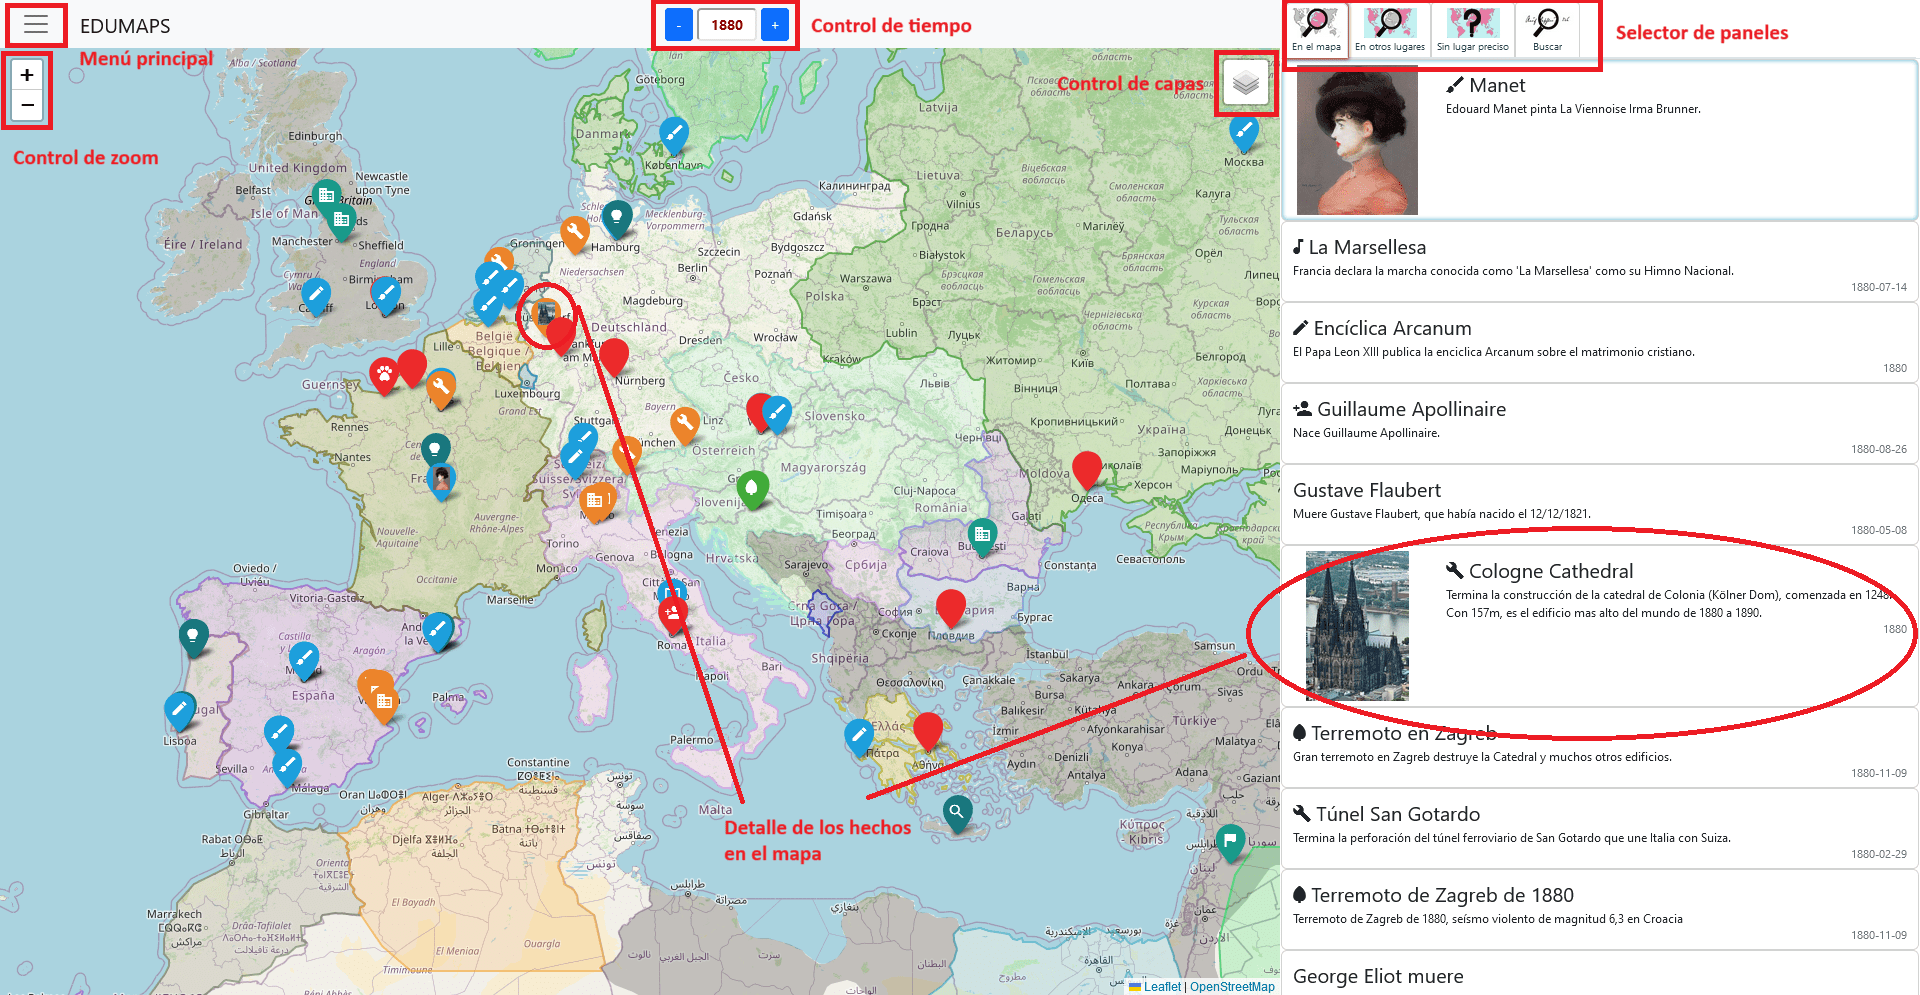
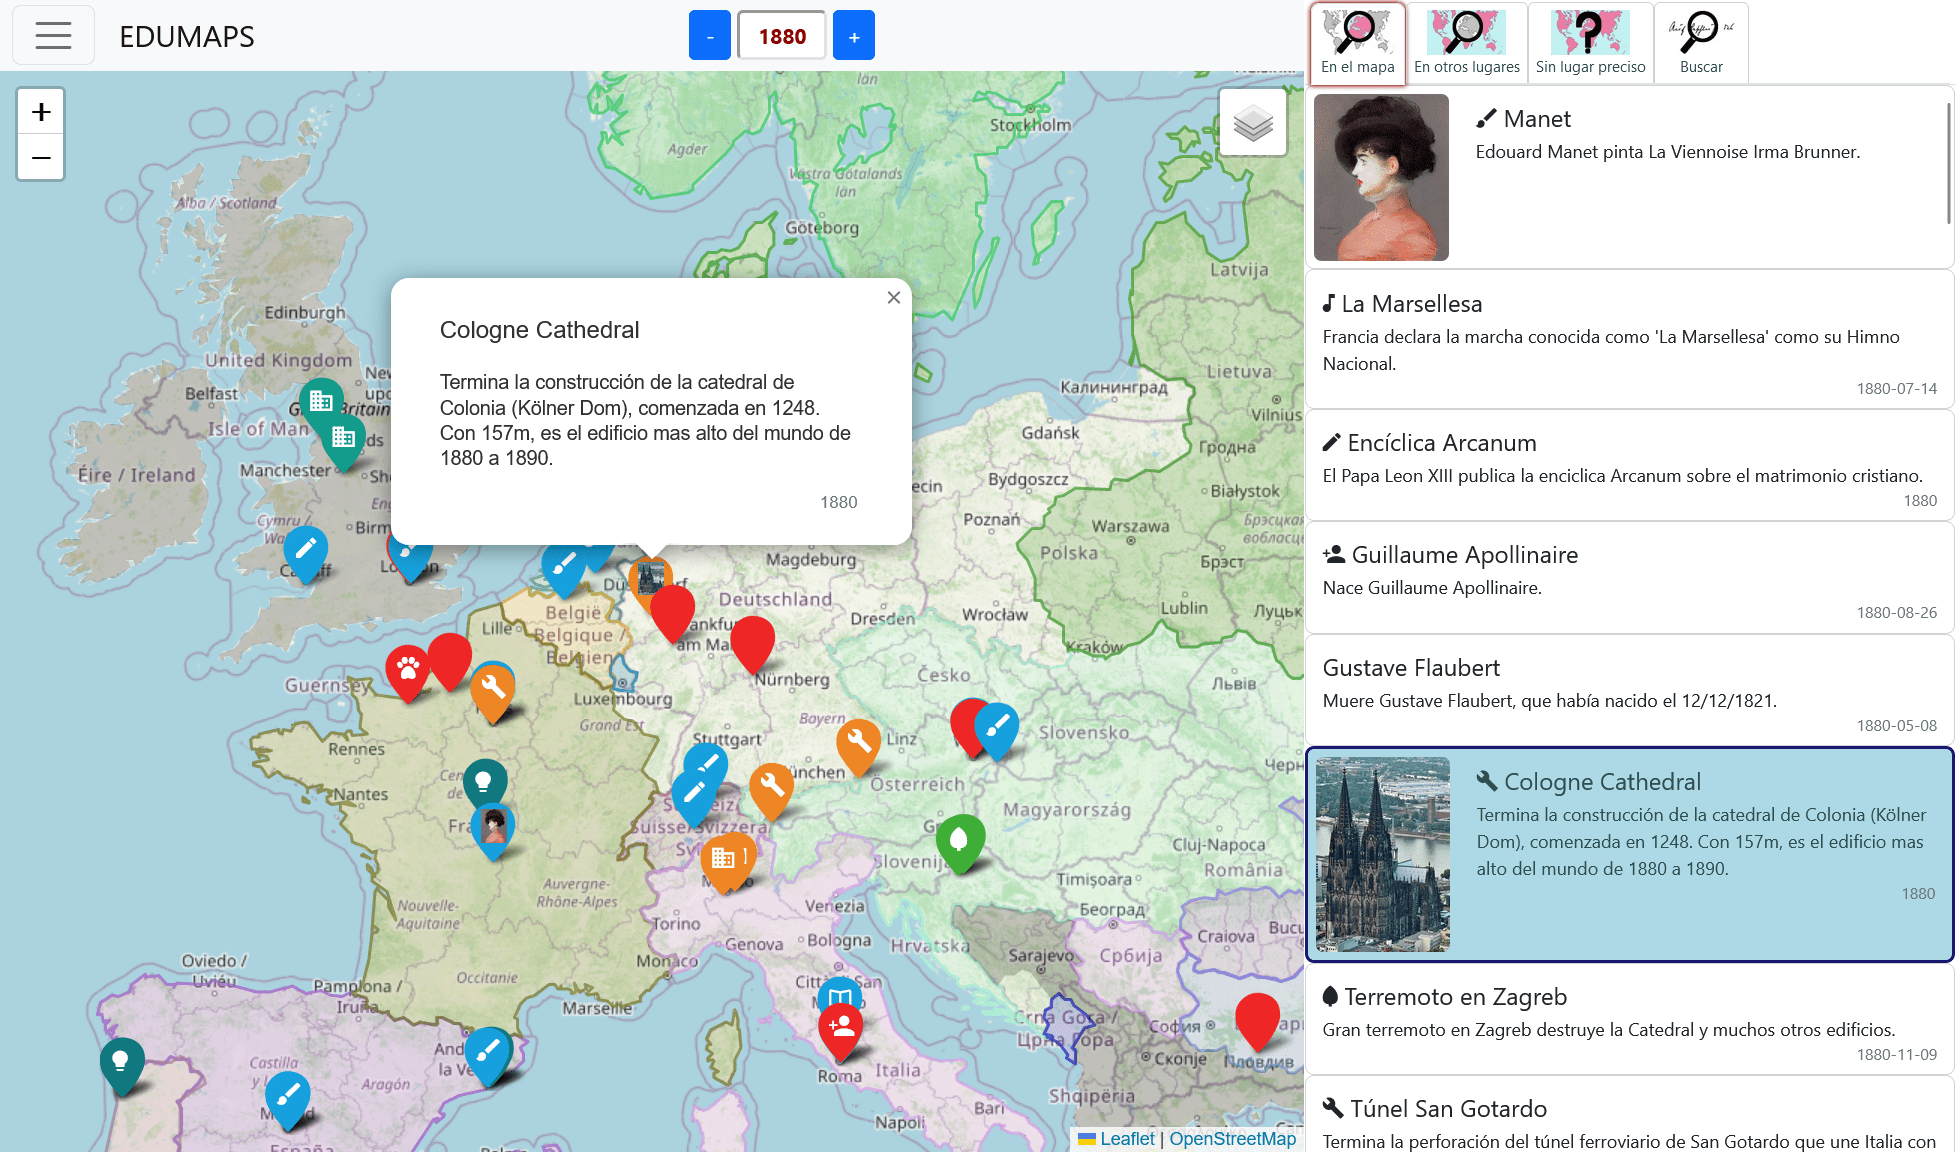
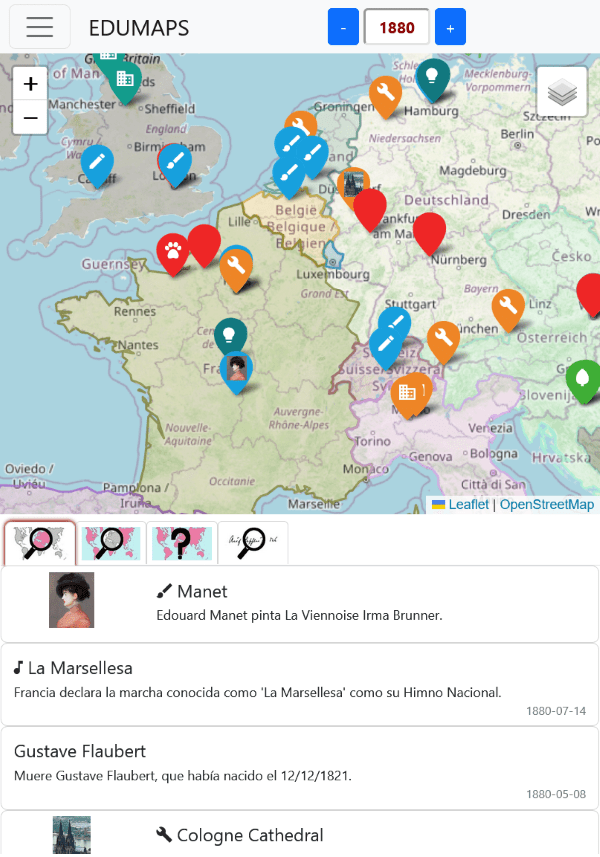
map
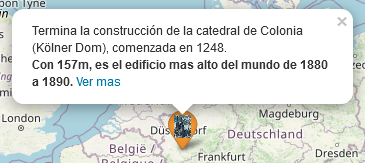
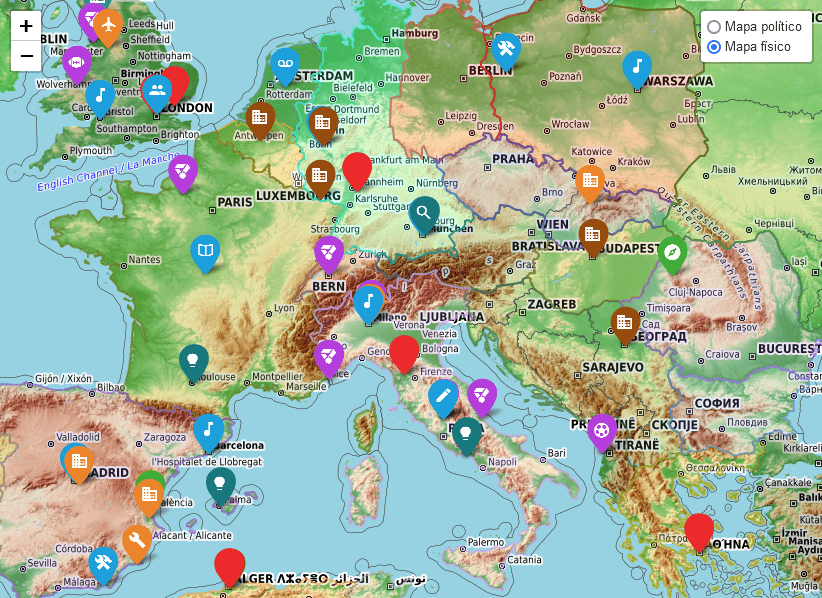
The map presents all the events that happen in the selected time and space. The markers use different colors and icons to represent the categories. By clicking on any of them you can see more details in a popup, and in the in map section. The map allows for scroll and zoom.
time selector
The time selector allows you to move forward or backward in time, in order to see the facts corresponding to a certain time. Accepts years between -10000 and current year.

Panels (or sections)
In map
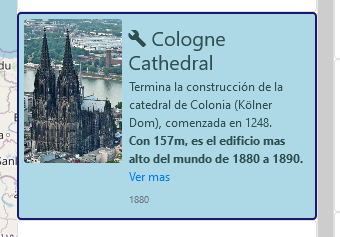
The section in map allows you to see the details of all the events of the time and place selected. By clicking on one, it is highlighted on the map.
Elsewhere
Section elsewhere allows you to see the events that happen at the same time, in other places on the map, outside the selected space. By clicking on one, it moves to the same.
Unknown location
Section unknown location shows facts that happen at the same time, but in an undefined place (either due to be too generic, or missing information). On click, it won't produce any movemente.
search
The search functionality allows to find relevant facts in any time and place.

When doing a search, the results are displayed in a new section, which can be used to go through them. Can be ordered by different criteria. These facts can be anywhere on the map and in any year. By selecting each, it moves to that time and place. And displays the selected result in context, updating the sections in map and elsewhere.

While showing search results, the clean button is enabled.
If there are too many results, alongside the quantity there's another quantity in parenthesis,
referring to all the matches found. To query them, a new search must be executed, trying to
enter more precise terms, in order to reduce the number of results found. Sample text shown:
50 results (out of 2897).
Order search results
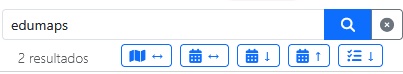
Next to the magnifying glass, there's a button to clear the search results. Below, it shows the number of results, and then several buttons that allow you to sort the results by different criteria:
- ↔ By geographic distance (closest first). When the map is moved, they automatically reorder.
- ↔ By temporal distance (closest first). Time can be in the past or future, so events that occurred before or after are interspersed. When the map is moved, they are not automatically rearranged.
- ↓ By date, oldest first.
- ↑By date, newest first.
- ↓ By fact's relevance.
- ↓ By relevance, understood as the similarity with the searched words.
Advanced search
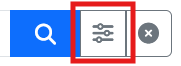
This control shows a form with options to refine the search, for example by setting date filters.
Special searches

While no search is performed, a list os special searches is displayed as alternative to use.
lessons
First examples showing what can be done, as a much more powerful way of use of the project. The goal is to present a lesson, or in other words a more complex topic from the story, usually covering different events and moments.
The lesson guides us through them, while leaving the application 100% functional, so that at all times one can see the rest of the context of what is being explaining. In this way, it seeks to enhance the person's analytical capabilities, and incentivize your own discovery and learning process. One can go back and forth through the lesson freely, and switch between different available lessons. The lessons are also sensitive to the context, so those that correspond to the time in question will be presented.
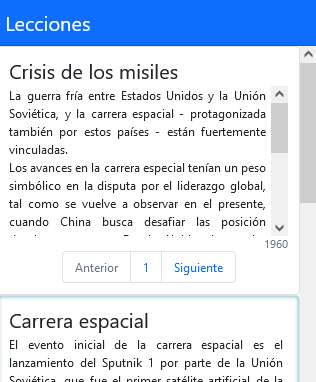
Users can use existing lessons or create their own. And ther might be several lessons presenting different views for the same historical process.
read aloud lessons - NEW
Some lessons include an icon to show that are available in audio. Then the user can listen to the lesson. Besides audio controls, it includes an auto-play toggle. It allows to go automatically through the steps. If the user does other searches or queries, auto-play will be paused, and can be re-enabled at any time.


main menu
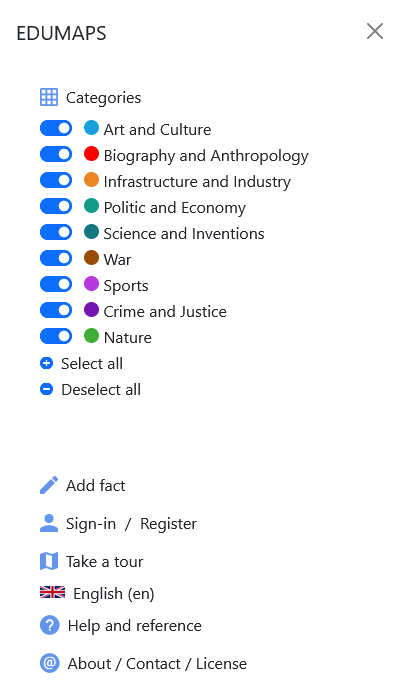
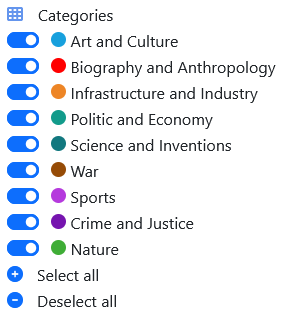
categories
The categories allow filtering the facts presented based on the type of events that you want to select.
add facts
User collaboration is now allowed, who can add facts to the project.
sign-in - register
Allows people to register as new user or log-in to help with the content.
take a tour
Interactive tour through main application functionality.
language control
Allows to select the language. English and Spanish supported. Important: it also modifies the content shown, it's not just the same facts translated.
smaller screens
The design adjusts to the screen's size. The content is the same, while disposition and presentation changes according to size. The goal is always to present the largest possible amount of information.
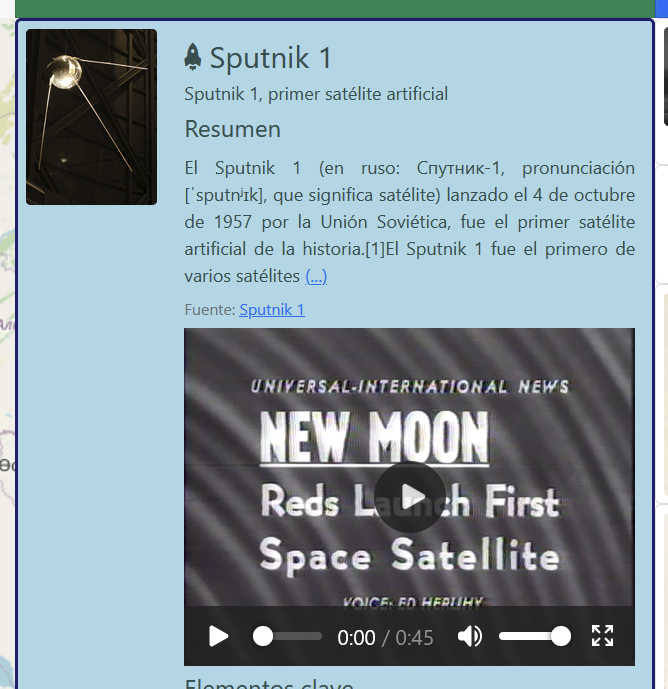
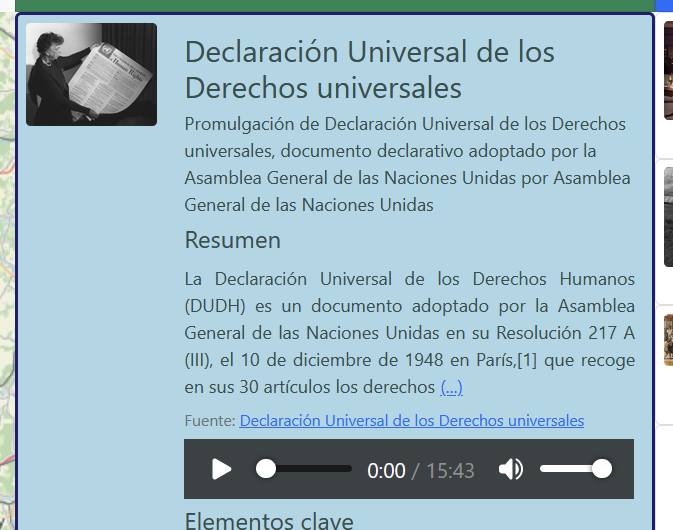
multimedia - NEW
Facts can now include multimedia content (like audio or video) to provide a richer experience.
layers control - NEW
Allows to select different base maps. Currently supports physical or political.
Add or Edit Facts
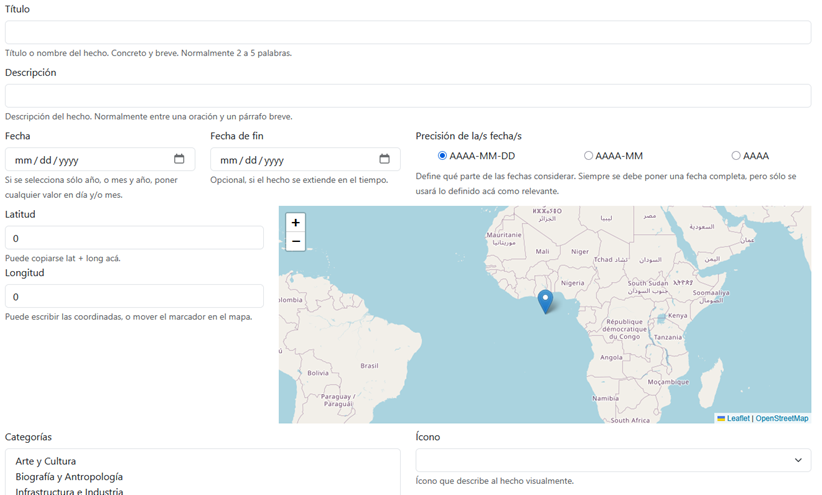
This section references the details of the form for adding or editing facts.
To add a new fact, access it from the application's main menu:

To edit a fact, you must log in to the project with your own account and enable the contributorMode setting, which activates the editing function when viewing facts (the small blue pencil icon to the left of the date).
Main Fields
Title
- Brief name or heading that identifies the fact.
- Required.
- We recommend keeping it short (less than 100 characters).
- Example:
"Foundation of Buenos Aires"
Description
- More detailed explanation of the fact.
- Required.
- May include historical context, significance, or consequences of the event.
- Example:
"The city of Buenos Aires was founded by Pedro de Mendoza in 1536, on the coast of the Río de la Plata."
Date
Date on which the fact occurred. A complete date including day, month, and year should always be provided. However, if the data is not exact, you can indicate that only the year, or the year and month should be considered, by setting the precision of the date(s).
If the fact spans over time, you can provide an end date to indicate the period during which it occurred.
Date
- Date of the fact.
- Required.
- Format:
dd/mm/yyyy. - Validations: Must be a valid date between -10000 and the current year.
- If the day or month is unknown, only the year or year and month can be used.
- Example:
02/02/1813
End Date
- Final date in case the fact has a duration (e.g., a historical period).
- Optional.
- If filled in, it must be a valid date equal to or later than the start date.
- Format:
dd/mm/yyyy. - Example:
09/02/1817(end of the Crossing of the Andes by the Liberating Army)
Precision of the Date(s)
- Level of detail or certainty regarding the date or dates associated with the fact.
- Required.
- Allows indicating whether the date has precision at the day, month, or year level.
- Available options:
YYYY-MM-DD: date defined by year, month, and day.YYYY-MM: date defined by year and month.YYYY: date defined by year.
- Example:
YYYY(if the fact occurred in the year 1823 but no more precise record exists)
Coordinates
Used to indicate the location where the fact occurred. There are several tools available to make entering this data easier. You can drag the marker on the map to the desired location, or first navigate to the place and then right-click to set it. Alternatively, you can directly enter the coordinates if they are already known.
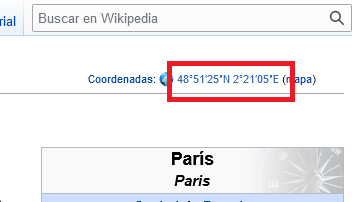
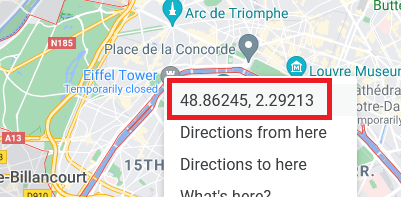
You can copy both coordinates from Wikipedia when they are displayed (usually in the top-right corner). Similarly, if you're using a map service like Google Maps, you can right-click on the location to view its coordinates. Clicking on them copies the values to your clipboard. In both cases, if you paste the full coordinate value into the Latitude field, the system will automatically split them into the corresponding fields.
Latitude
- North-south coordinate of the fact.
- Required.
- Accepted formats: Decimal (
48.856944) or sexagesimal (48°51′25″ N). - Validations: Must be between
-90and90.
Longitude
- East-west coordinate of the fact.
- Required.
- Accepted formats: Decimal (
2.352222) or sexagesimal (2°21′12″ E). - Validations: Must be between
-180and180.
Automatic feature: When pasting full coordinates into the Latitude field, the system automatically splits them into both fields.
Categories
- Thematic classification of the fact (e.g.: History, Culture, Politics, etc.).
- Required: At least one category must be selected.
- Use the
Ctrlkey (Windows) orCmdkey (Mac) to select multiple categories.
Icon
- Representative image of the fact.
- Required.
- Relation: Depends on the selected category.
Image URL
- Web address of an illustrative image for the fact.
- Requirement: Optional, but recommended.
- The image must be free of copyright or in the public domain.
- Example:
https://upload.wikimedia.org/wikipedia/commons/thumb/0/0d/La_Plata_Catedral_2.jpg/800px-La_Plata_Catedral_2.jpg
General Validations
| Field | Required | Validation |
|---|---|---|
| Title | ✅ Yes | Not empty, maximum 100 characters |
| Description | ✅ Yes | Not empty |
| Date | ✅ Yes | Valid date between -10000 and current year |
| End Date | ❌ No | Valid date between -10000 and current year |
| Date Precision | ✅ Yes | One of the available options |
| Latitude | ✅ Yes | Number between -90 and 90 |
| Longitude | ✅ Yes | Number between -180 and 180 |
| Category(ies) | ✅ Yes | At least one category selected |
| Icon | ✅ Yes | An icon must be selected |
| Image | ❌ No | Valid URL |
License and Collaborative Use
- License: All added content is published under the CC0 license, meaning it is released into the public domain.
- Responsibility: Data may be reviewed, modified, or removed if considered inappropriate or incorrect.
- Log in: It is recommended to register and log in to collaborate.
Return to Map
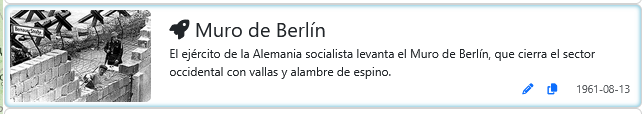
Once the form is completed and saved, the user returns to the main map where the fact appears with its location and details.
List of Previously Worked Facts
If other facts have been created or modified, they are displayed in a list that makes it easy to view them on the map, edit again, or copy their identifier (for example, to use as a step in a lesson).
Advanced Options
These options are available under a hidden section (Show advanced options) and are mainly intended for contributors with deeper technical knowledge.
Element Type
- Defines whether the fact represents a point event, an area (identified by a circle), or a lesson.
- Required.
- Options: Point marker, Area or circle, Lesson.
- Affects how the content is visualized (iconography, labels, details).
- The default value is Point Marker
Language
- Indicates the primary language of the fact's content, under which it will be visible.
- Required.
- Used to define the language in which the title and description of the fact are written and stored.
- Example:
Spanish,English
Minimum Zoom
- Zoom level at which the fact begins to appear on the map.
- Range: 0 to 18 (with 0 being global world view and 18 being highly detailed local view).
- Useful for showing facts only at certain levels of detail.
- Example:
5(visible when viewing the continent)
Maximum Zoom
- Zoom level at which the fact stops appearing on the map.
- Range: 0 to 18.
- Used together with "Minimum Zoom" to control visibility range.
- Example:
12(no longer visible when zoomed in too closely to urban detail)
Source or Web Page with More Information (URL)
- Origin of the data. Bibliographic reference or URL where the information was obtained.
- Optional but recommended.
- Helps verify the accuracy of the content and facilitates future reviews.
- Example:
https://www.argentina.gob.ar/historia/fundacion-de-buenos-aires
Aliases or Additional Tags
- List of keywords related to the fact.
- Optional.
- Improves semantic search and filtering within the map.
- Example:
sanmartinian campaign
Multimedia Content
- List of multimedia files associated with the fact (audio, video, additional images, PDF documents, etc.).
- Optional.
- Each file must include:
- A valid URL.
- A type (audio, video, document).
- The language of the content.
Relationships
- List of other facts, people, or institutions related to this fact.
- Optional but valuable for the semantic network.
- Each relationship must include:
- ID of the related element.
- Type of relationship (e.g., cause, consequence, successor).
- Brief title or description of the relationship.
- Start year of the related fact (if applicable).
- End year of the related fact (if applicable).
Advanced reference
This section references some advanced features available, even when some of these are no directly accessible from the UI.
Supported parameters to add in query string
- lat
- initial latitude to center the map (must be used together with lon)
- lon
- initial longitude to center the map (must be used together with lat)
- z
- initial zoom (only used if together with coordinates)
- y
- initial year (only valid integers from -10000 to current year)
- ye
- final year (only valid integers from -10000 to current year)
- f
- fact id to select
- l
- lesson id to present
- ls
- lesson step to start at
- t
- enable tour to present main functionalities
- lang
- language (currently supports 'en' & 'es')
- q
- search string (previously 'q', changed on Jun 2025)
Supported config values, currently only to define as parameters in query string
- contributorMode
- enables to edit facts (default value: false)
- useCachedYears
- uses cached years for requests (default value: true)
- traceEnabled
- shows trace window (default value: false)
- fullyFunctional
- used in DEV to reduce web traffic or have slow Internet connections (default value: true)
- showAllFacts
- avoid zoom filter for facts, showing all facts everytime (default value: false)
- maxRetryTimeSeconds
- maximum retry time in seconds to wait between re-attempts to fetch facts (default value: 60)
- specialSearches
- special searches offered to users, like anniversaries, by location and others (default value: false)
- factDetails
- selects what sections to show for the selected fact (default value: all)
- extraInfo
- show extra information on screen to add more data details (default value: false)
- svgIcons
- show SVG icons for highlighted elements (default value: false)
- lessonViewType
- if only current segments of a travel lesson must be shown (1) or all must remain visible (2) (default value: 2)
- lessonMedia
- show audio or video content for the lesson steps (default value: true)
- lessonAutoplay
- defines if lesson must go automatically to next step and start audio (default value: true)
- factsLimit
- maximum quantity of facts to keep in browser; if exceded it removes the ones that don't belong to current year (default value: 10000)
- liveSearch
- enables live search: results update automatically as the user types, without needing to press the search button (default value: true)
- blurryBorders
- enables blurry borders: show country borders blurry when data is not so precise (default value: true)
- geoQuality
- GeoJSON maps quality (more acurate is more traffic). Accepted values: 'auto', 'full', or 'simplified' (default value: auto)
It's recommended to use a PC and a monitor with good resolution. Anyway, tables & mobile cellphones are also supported.